
OCI Observability Part#3
Achieve End-to-End Visibility Across Enterprise Applications Using OCI Application Performance Monitoring and Stack Monitoring
Ahmed Hassan
6/29/20265 min read
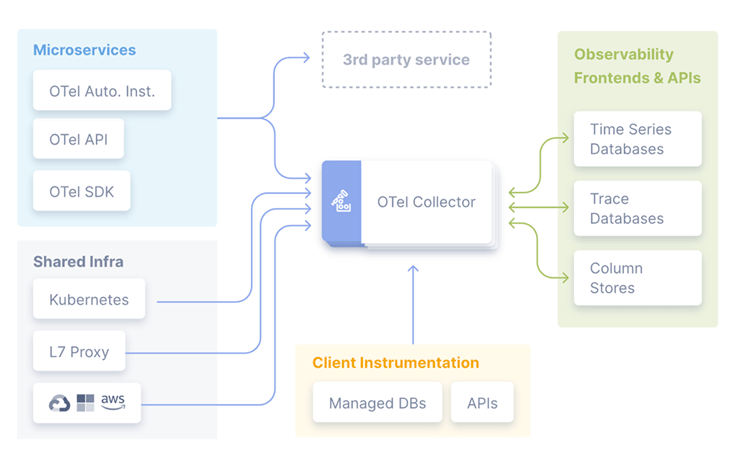
Infrastructure tells you whether servers are alive. Observability tells you whether your business is
Imagine it's Monday morning. An online banking platform has just opened for business. Within minutes, the operations center begins receiving calls from customer support. Users report that transfers are taking nearly twenty seconds to complete. Curiously, none of the infrastructure dashboards indicates a problem. CPU utilization across the Kubernetes cluster remains below 40 percent. Memory usage is stable. Database response times are well within expected thresholds. Load balancers CONTINUE reporting healthy backend services.
From the perspective of traditional monitoring, everything appears normal. Yet thousands of customers are experiencing delays.
Where do you begin?
Do you investigate the database?
The network?
The application servers?
The API Gateway?
Or perhaps the identity provider?
This is precisely the challenge that modern operations teams face every day.
As enterprise applications become increasingly distributed, failures rarely originate where they become visible. A slow response observed by an end user may actually stem from an overloaded authentication service, a delayed third-party API, or a single microservice waiting on a database query.
Traditional monitoring identifies symptoms. Application observability reveals the journey.
This is the role of OCI Application Performance Monitoring (APM) and Stack Monitoring.
Together, they provide a complete view of application behavior from the first click in a browser to the final database transaction allowing architects and operations teams to understand not just whether systems are healthy, but how every component contributes to the overall user experience.
Modern Applications Behave Like Ecosystems
One of the biggest changes introduced by cloud-native architecture is that applications no longer operate as single units.
A business transaction often flows through numerous independent services before reaching completion.
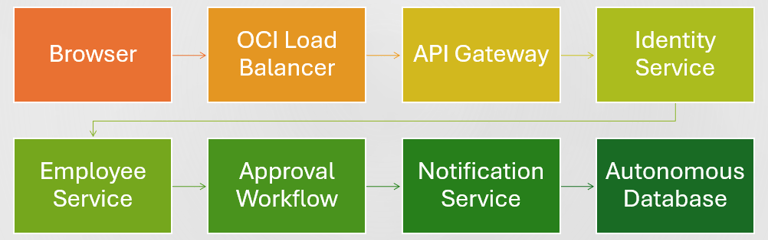
Consider a simple employee self-service portal.
When a user clicks "Submit Leave Request", the application may perform the following sequence of operations:
Each component contributes only a fraction of the overall response time. If just one service introduces latency, the user experiences the entire transaction as slow.
Looking only at infrastructure metrics rarely reveals which component is responsible. In comparison, Application observability follows the transaction itself.
From Infrastructure Health to Business Experience
Many organizations still define operational success using infrastructure metrics.
Questions such as:
Is CPU utilization acceptable?
Is available memory sufficient?
Are disks healthy?
remain important. However, they don't necessarily reflect customer experience.
Imagine an e-commerce platform during a seasonal promotion. Infrastructure utilization remains comfortably below capacity. Meanwhile, a recently deployed recommendation engine introduces an additional two seconds of processing time into every checkout transaction.
The platform remains technically healthy. Customers begin abandoning their shopping carts.
From a business perspective, the platform is failing.
This distinction highlights why application performance has become one of the most valuable operational metrics available. Modern observability focuses on business outcomes rather than infrastructure statistics alone.
Architect's Perspective
During architecture reviews, I often encourage teams to identify three or four business transactions that define success for their application.
Examples include:
Completing a payment
Logging into the customer portal
Creating a purchase order
Processing a healthcare appointment
Submitting a leave request
These transactions become the foundation of an observability strategy.
If you can follow these journeys end-to-end, you understand far more about application health than any individual CPU graph could reveal.
OCI Application Performance Monitoring
Oracle Cloud Infrastructure APM is designed to observe applications from the user's perspective. Rather than focusing on servers, it tracks complete business transactions across distributed environments.
Key capabilities include:
Distributed tracing
Real User Monitoring (RUM)
Synthetic Monitoring
Application topology
Service maps
Performance analytics
Custom dashboards
OpenTelemetry integration
Together, these capabilities provide visibility into both technical performance and user experience.
Distributed Tracing: Following Every Request
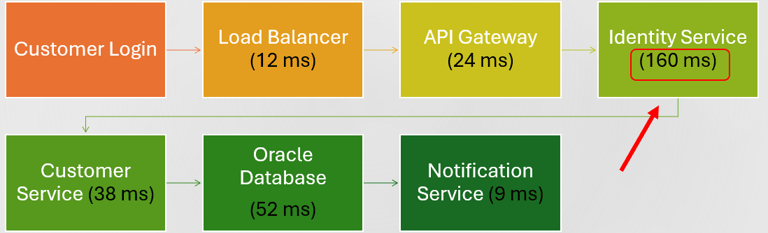
Distributed tracing is arguably the most transformative capability within modern observability platforms. Every user request receives a unique Trace ID.
As the request moves through APIs, microservices, middleware, databases, and external integrations, that identifier travels with it.
Each component records its contribution as a span. The result is a complete timeline of the transaction.
Instead of investigating six independent systems, engineers immediately identify the authentication service as the primary contributor to response time.
Real User Monitoring
Performance isn't measured in data centers. It's measured by customers. Real User Monitoring captures actual user interactions with an application.
Typical measurements include:
Page load time
JavaScript execution
Browser rendering
Network latency
Geographic performance
Device characteristics
This information answers questions that infrastructure monitoring cannot.
Do users in one region experience slower response times?
Does browser performance degrade after a software release?
Are mobile devices affected differently than desktop clients?
Understanding user experience transforms observability from infrastructure management into business performance management.
Synthetic Monitoring
Real users generate valuable telemetry. Synthetic Monitoring complements that information by creating controlled transactions.
Automated tests periodically perform activities such as:
Logging into applications
Searching for products
Completing purchases
Invoking REST APIs
Because these tests execute continuously, operations teams detect problems before customers report them.
Synthetic Monitoring also supports Service Level Objectives (SLOs) by validating application availability from multiple geographic regions.
Stack Monitoring: Seeing the Entire Technology Stack
While APM focuses on transactions, Stack Monitoring provides visibility across the supporting infrastructure.
It automatically discovers relationships between:
Compute Instances
Oracle Databases
WebLogic Domains
Oracle HTTP Server
Apache Tomcat
Kubernetes Clusters
Oracle E-Business Suite
Oracle SOA Suite
Oracle GoldenGate
Hosts
Middleware
Rather than presenting isolated components, Stack Monitoring builds a connected operational topology. Architects immediately understand how infrastructure supports business applications.
Enterprise Example: Oracle E-Business Suite
Consider an Oracle E-Business Suite deployment running on OCI. A typical transaction might involve:
Oracle HTTP Server
WebLogic Managed Servers
Concurrent Manager
Oracle Database
Shared Storage
If users experience slow performance while submitting purchase orders, Stack Monitoring immediately highlights relationships between these components. Combined with APM traces, engineers identify whether delays originate from middleware, SQL execution, concurrent processing, or infrastructure.
This integrated view dramatically reduces troubleshooting effort.
OpenTelemetry and the Future of Observability
Modern observability increasingly relies on open standards. OCI APM supports OpenTelemetry, enabling organizations to instrument applications consistently across cloud providers.
This is particularly valuable for hybrid and multi-cloud environments.
Rather than maintaining separate instrumentation strategies for different platforms, development teams can adopt a common telemetry framework.
As organizations modernize applications, OpenTelemetry is becoming the preferred approach for collecting metrics, traces, and logs.
Lessons Learned
One observation consistently emerges across enterprise projects. The most difficult production incidents are rarely caused by complete system failures. They result from small performance degradations distributed across multiple services. No individual component appears unhealthy. Together, they create a poor customer experience.
Distributed tracing exposes these hidden relationships. Instead of troubleshooting systems individually, engineers investigate the transaction itself. That subtle shift significantly reduces Mean Time to Resolution (MTTR) while improving operational confidence.
Design Recommendations
When implementing OCI APM and Stack Monitoring:
Instrument business-critical applications first.
Prioritize business transactions over infrastructure metrics.
Adopt OpenTelemetry for new cloud-native services.
Define Service Level Objectives before configuring alerts.
Integrate APM with Logging and Monitoring to accelerate root cause analysis.
Use Stack Monitoring to understand dependencies before production incidents occur.
Regularly review traces to identify optimization opportunities, not just failures.
Observability should evolve alongside the application, not remain static after deployment.
Key Takeaways
Infrastructure metrics alone cannot explain application behavior.
OCI APM follows transactions across distributed services.
Distributed tracing dramatically reduces troubleshooting time.
Real User Monitoring measures actual customer experience.
Synthetic Monitoring identifies issues before users report them.
Stack Monitoring visualizes relationships across enterprise infrastructure.
OpenTelemetry provides a future-proof approach to application instrumentation.
Combining APM with Monitoring, Logging, and Analytics delivers true end-to-end observability.
Conclusion
Enterprise architecture has entered an era where understanding application behavior is as important as maintaining infrastructure availability. Modern business services depend on distributed systems, dynamic infrastructure, and increasingly complex integrations. As these environments continue to evolve, operational success will depend less on collecting more telemetry and more on connecting it in meaningful ways.
Oracle Cloud Infrastructure provides a comprehensive observability platform that enables this transformation. Monitoring, Logging, Events, Notifications, Application Performance Monitoring, Stack Monitoring, and Analytics are not isolated products; they are complementary capabilities that together create a unified operational view.
For architects, the lesson is clear: observability should be designed into the platform from the beginning. The organizations that invest in end-to-end visibility before production incidents occur will resolve issues faster, improve service reliability, and deliver a consistently better experience for their users.
Ultimately, observability is not about watching systems. It is about understanding them. And in an increasingly distributed world, that understanding has become one of the most valuable capabilities an enterprise can possess.
© 2026. All rights reserved.
Stay Updated
Get the latest posts on OCI and cloud tech