
OCI Observability Part#2
Building an Intelligent Operations Platform with Oracle Cloud Infrastructure
Ahmed Hassan
6/28/20267 min read
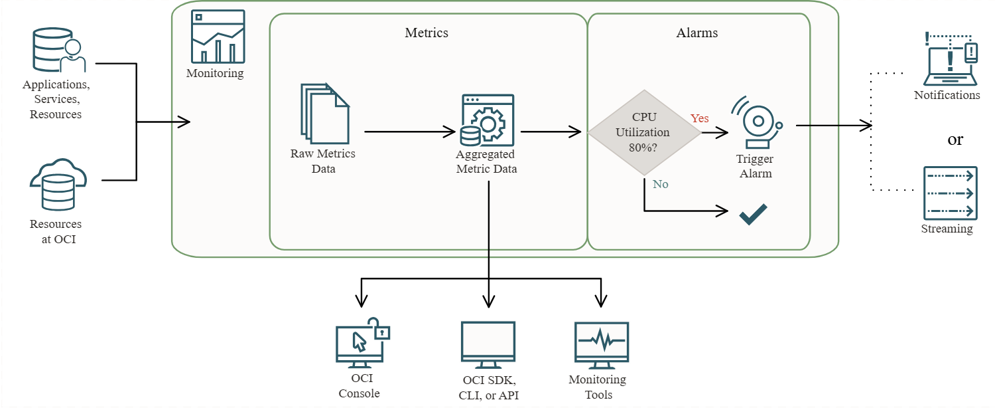
Monitoring tells you something has changed. An intelligent operations platform understands what changed, why it changed, and what should happen next.
Ask ten organizations how they monitor production workloads, and you'll probably receive ten different answers. Some rely heavily on infrastructure dashboards. Others invest in centralized logging platforms. Larger enterprises often operate several monitoring products simultaneously, each owned by a different operational team. Network engineers watch network latency, database administrators monitor SQL performance, security teams review audit events, while application teams analyze logs generated by their own services.
Each team sees part of the picture. Very few see the whole picture.
During normal operations this fragmented approach appears sufficient. Systems remain available, dashboards stay green, and operational metrics look reassuring.
The real challenge begins during a production incident.
A customer reports that an application has become unresponsive.
The infrastructure team confirms compute resources are healthy.
Database administrators report acceptable response times.
Network monitoring indicates no connectivity issues.
Security monitoring detects nothing unusual.
Meanwhile, the business continues losing transactions.
Every team has visibility. No one has clarity.
This scenario illustrates why modern enterprises are moving beyond isolated monitoring tools toward integrated operations platforms.
An operations platform isn't defined by the number of dashboards it contains. Its value comes from its ability to correlate information, automate repetitive tasks, and guide engineers toward the root cause instead of overwhelming them with disconnected alerts.
Oracle Cloud Infrastructure approaches this challenge differently than many cloud providers. Rather than offering individual monitoring products that operate independently, OCI provides an integrated ecosystem where metrics, logs, events, notifications, analytics, and automation complement one another.
This article explores how these services work together to create an intelligent operational foundation for enterprise cloud environments.
Modern Operations Are About Correlation, Not Collection
One of the biggest misconceptions surrounding observability is that success depends on collecting more telemetry. In reality, enterprise environments already generate extraordinary amounts of operational data.
A medium-sized Kubernetes cluster alone may produce millions of log entries each day.
Every Compute instance emits infrastructure metrics.
Every database generates performance statistics.
Every API request creates additional telemetry.
Every cloud service records operational events.
The problem isn't data collection. The problem is connecting that data into a meaningful operational story.
Imagine driving a modern vehicle.The dashboard displays engine temperature, fuel level, oil pressure, tire pressure, battery voltage, navigation, and dozens of additional indicators. If every warning light illuminated simultaneously, the dashboard would become nearly useless.
Good vehicle design prioritizes the information that matters most while correlating related events.
Enterprise operations should follow the same principle. Successful operations teams spend less time searching for information and more time understanding it.
Designing an Intelligent Operations Platform
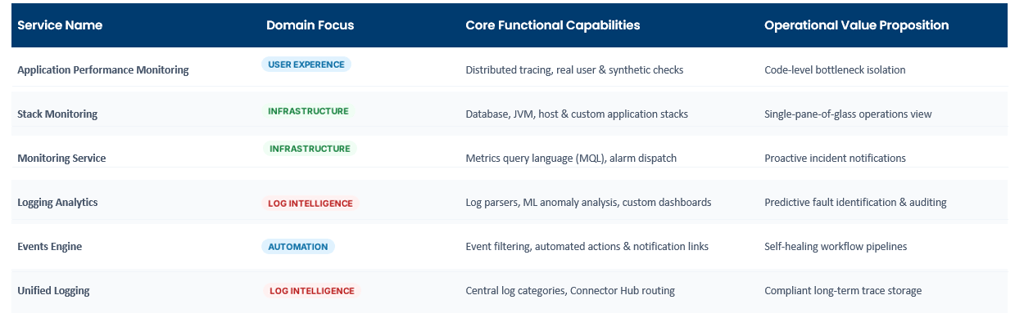
An effective OCI observability platform consists of six closely connected capabilities.
Instead of viewing them as individual services, think of them as stages within a continuous operational workflow.
Every stage builds upon the previous one.
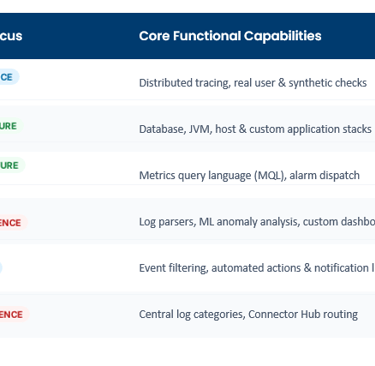
Monitoring detects abnormal behavior.
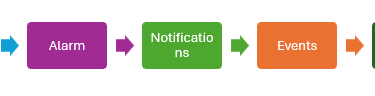
Notifications inform the appropriate teams.
Events identify resource changes.
Automation performs repetitive operational tasks.
Logging and Analytics explain why the issue occurred.
Together they transform monitoring into operational intelligence.
OCI Monitoring: The Operational Heartbeat
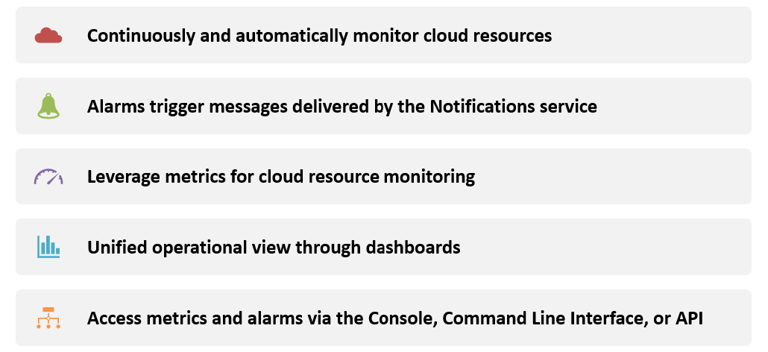
Every operational platform begins with metrics. OCI Monitoring continuously collects performance information from cloud resources, operating systems, applications, and custom workloads.
Unlike traditional monitoring tools that focus exclusively on infrastructure, OCI Monitoring supports both native cloud metrics and custom business metrics.
This distinction is important.
Infrastructure metrics answer questions like:
Is CPU utilization increasing?
Are storage volumes approaching capacity?
Has network throughput changed?
Business metrics answer different questions.
How many successful payments occurred?
How many customer registrations failed?
How many purchase orders were processed today?
Which API experienced the highest latency?
In mature organizations, business metrics often provide earlier indicators of operational issues than infrastructure metrics alone.
Architect's Perspective
One recommendation I frequently make during architecture reviews is to monitor customer outcomes rather than infrastructure utilization.
Customers don't care whether CPU utilization reaches 90 percent. They care whether they can complete a payment, submit an order, or access a healthcare record.
Infrastructure metrics remain important, but they should support business objectives rather than replace them.
OCI Alarms: Reducing Alert Fatigue
Many organizations unintentionally create thousands of operational alerts. Ironically, more alerts often result in slower responses.
Engineers become desensitized to constant notifications and begin ignoring alarms altogether.
Alert fatigue represents one of the most common operational risks in large environments.
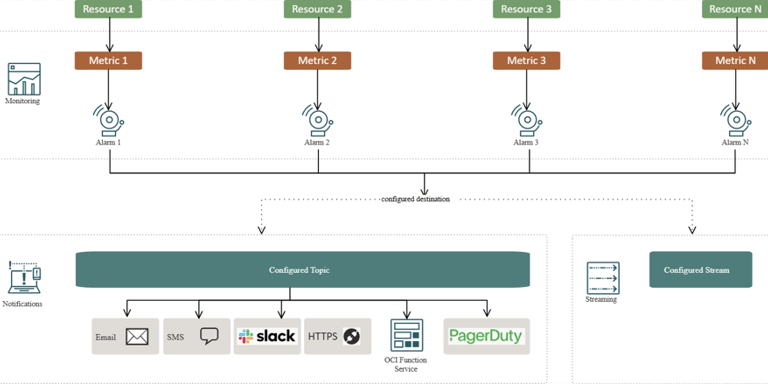
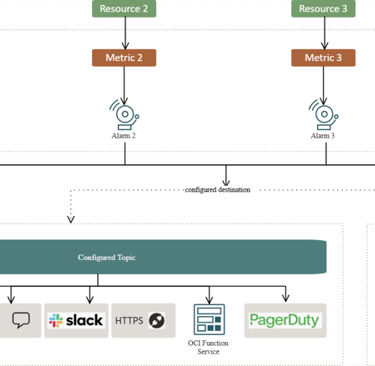
OCI Monitoring addresses this challenge through flexible alarm definitions using Monitoring Query Language (MQL).
Rather than triggering notifications whenever CPU utilization exceeds an arbitrary threshold, alarms can evaluate trends, durations, and combinations of metrics.
For example:
CPU remains above 85% for fifteen consecutive minutes.
API response time increases while request volume remains constant.
Database connections continue rising despite reduced user traffic.
These contextual alarms generate fewer false positives and produce more meaningful operational signals.
OCI Logging: Capturing Operational Context
Metrics reveal symptoms while Logs explain behavior.
OCI Logging centralizes operational information from Oracle Cloud services, operating systems, middleware, Kubernetes clusters, custom applications, and enterprise workloads. Instead of searching multiple servers individually, engineers can investigate operational events from a centralized interface.
For example, consider an authentication failure. Infrastructure metrics may indicate healthy servers. Application logs reveal repeated token validation errors. Audit logs show recent IAM policy modifications. Together, these observations immediately narrow the investigation. Without centralized logging, engineers would manually search multiple systems before discovering the connection.
Logging Analytics: Turning Data into Insight
Collecting logs is relatively straightforward.
Understanding millions of log entries is considerably more difficult. OCI Logging Analytics applies intelligent analysis across operational data to identify patterns that engineers might otherwise overlook.
Rather than searching individual log entries, operations teams can detect:
recurring application exceptions,
unusual login behavior,
sudden increases in HTTP errors,
infrastructure anomalies,
performance degradation trends.
This transforms log management from reactive troubleshooting into proactive operational analysis.
Events: The Missing Piece of Operational Automation
Many operational changes occur without human intervention.
Instances are launched.
Resources are terminated.
Policies are modified.
Databases are created.
Storage buckets change state.
These activities generate operational events.
OCI Events CONTINUALLY monitors cloud resources and publishes notifications whenever predefined changes occur. Instead of polling infrastructure repeatedly, applications receive information only when meaningful events occur.
This event-driven model reduces operational overhead while enabling real-time automation.
Notifications: Delivering Information to the Right People
Generating operational intelligence has little value unless the appropriate teams receive it quickly.
OCI Notifications distributes alerts using multiple delivery mechanisms, including:
Email
SMS
Slack
Microsoft Teams
PagerDuty
HTTPS endpoints
Oracle Functions
Different events often require different audiences.
Infrastructure failures may notify operations engineers.
Security events notify security analysts.
Business application failures notify support teams.
Separating notification channels reduces unnecessary operational noise while improving response quality.
Connector Hub: The Integration Engine
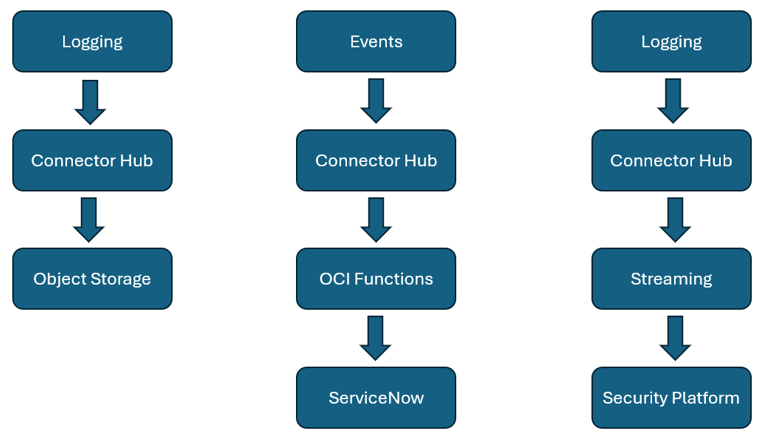
Enterprise observability rarely ends within a single cloud platform. Organizations often archive logs, forward telemetry to SIEM platforms, integrate with ticketing systems, or trigger automated workflows.
OCI Connector Hub acts as the integration layer connecting these operational services.
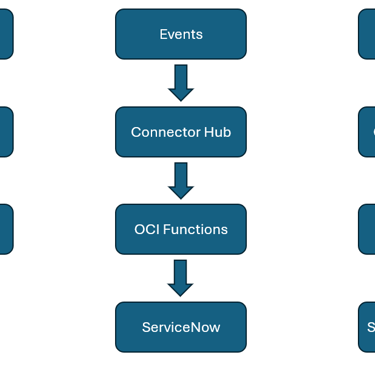
Typical workflows include:
Connector Hub eliminates much of the custom integration work traditionally required between monitoring systems.
Building an Automated Operations Platform
The real power of OCI Observability emerges when these services operate together.
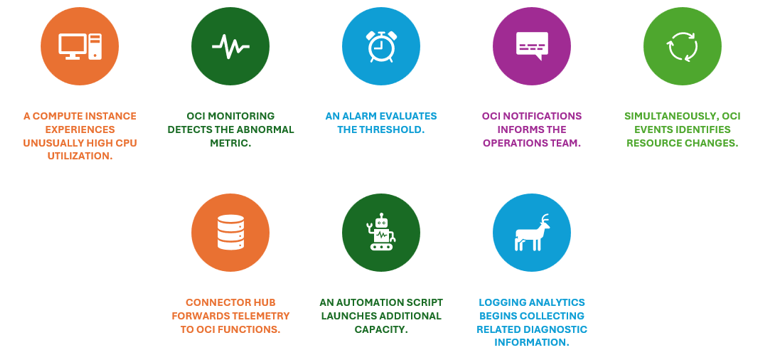
Consider a production scenario.
Within seconds, engineers receive both the alert and the supporting operational evidence while the platform begins correcting itself. This represents a fundamental shift.
Operations teams move from reacting to failures toward designing platforms capable of responding intelligently.
Lessons Learned
Across enterprise implementations, I've found that organizations often invest heavily in monitoring but relatively little in operational design.
The technology is rarely the limiting factor....Processes are.
Clear ownership, standardized telemetry, meaningful alerting, and thoughtful automation consistently deliver greater operational improvements than simply adding another monitoring product.
The most successful environments aren't those with the largest number of dashboards. They're the ones where monitoring, logging, analytics, and automation work together as a single operational capability.
Key Takeaways
Effective observability depends on correlating telemetry, not collecting more of it.
OCI Monitoring should include business metrics alongside infrastructure metrics.
Meaningful alarms reduce alert fatigue and improve response quality.
Centralized logging provides the context required for root cause analysis.
Logging Analytics transforms operational data into actionable insights.
Events, Notifications, and Connector Hub enable intelligent automation.
An enterprise operations platform is built by integrating these capabilities not by deploying them in isolation.
Conclusion
As cloud environments continue to grow in complexity, operational success increasingly depends on how quickly teams can move from detection to understanding, and from understanding to action.
Oracle Cloud Infrastructure provides the building blocks for this journey, but technology alone is only part of the equation. The real value emerges when Monitoring, Logging, Analytics, Events, Notifications, and Automation are designed as a cohesive platform rather than a collection of independent services.
In the final article of this series, we'll shift our focus from infrastructure to applications. We'll explore how OCI Application Performance Monitoring (APM) and Stack Monitoring deliver true end-to-end visibility by tracing user transactions across distributed services, middleware, databases, Kubernetes clusters, and enterprise Oracle workloads helping architects understand not just whether systems are healthy, but how users actually experience them.

© 2026. All rights reserved.
Stay Updated
Get the latest posts on OCI and cloud tech