
OCI Observability Part#1
Beyond Dashboards: Why Observability Has Become a Core Enterprise Capability
Ahmed Hassan
6/27/20267 min read
Healthy infrastructure doesn't always mean healthy applications. Modern cloud operations require more than monitoring; they require understanding.
Several years ago, during an architecture assessment for a large enterprise preparing to migrate critical business applications to the cloud, I asked a question that appeared deceptively simple.
"If your CEO called right now because customers could no longer complete a transaction, how would your operations team identify the root cause?"
The response came quickly.
"We have dashboards for everything."
And they truly did.
There were dashboards for compute utilization, database performance, network throughput, storage capacity, middleware health, Kubernetes clusters, application availability, and security events. Every operational team had invested considerable effort in building visibility into its own domain.
Then I asked a second question.
"How would you determine whether the issue started in the application, the database, an API integration, your identity provider, or somewhere else entirely?"
The discussion changed immediately.
The challenge wasn't a lack of monitoring. The challenge was understanding how all those individual pieces worked together.
That experience has stayed with me because it reflects a pattern I've encountered repeatedly across enterprise environments. Organizations have become exceptionally good at collecting operational data, yet many still struggle to transform that data into meaningful insight. They know something has failed, but determining why often requires engineers to manually correlate information from multiple tools, teams, and dashboards.
Cloud computing has amplified this challenge. Applications are no longer confined to a handful of servers. A single business transaction may involve an API Gateway, containerized microservices, serverless functions, managed databases, external identity providers, message queues, and third-party SaaS platforms. Each component produces its own metrics, logs, alerts, and events. Individually, they provide useful information. Collectively, they can overwhelm operations teams unless viewed through a unified lens.
This is where observability changes the conversation.
Rather than asking whether individual components are healthy, observability asks a more important question: How is the application behaving as a complete system?
That shift in perspective is transforming enterprise operations. It enables organizations to investigate unexpected problems, understand complex dependencies, and reduce the time required to identify root causes.
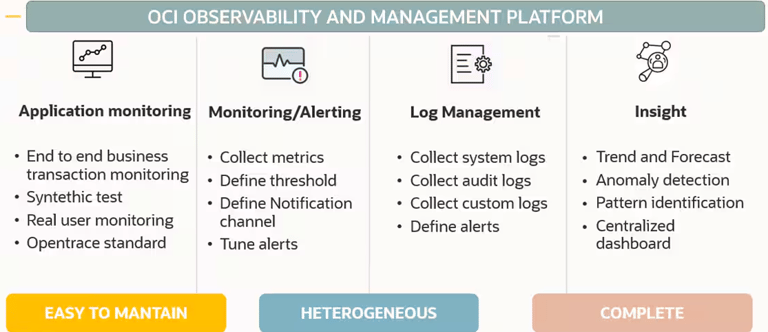
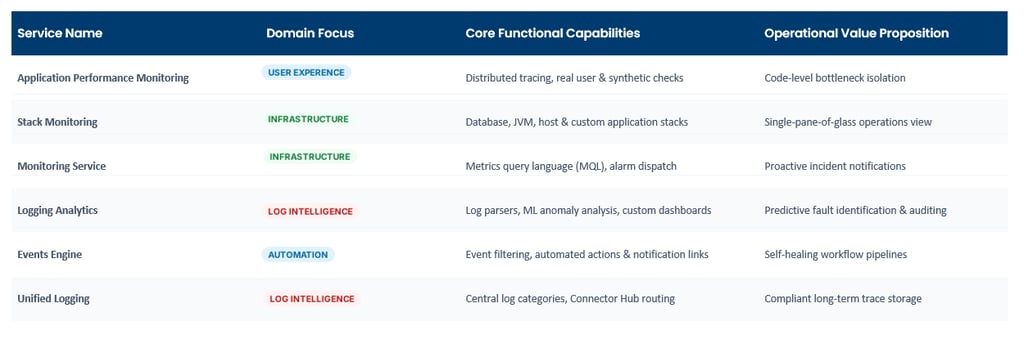
Oracle Cloud Infrastructure embraces this philosophy through an integrated observability platform that combines Monitoring, Logging, Application Performance Monitoring (APM), Stack Monitoring, Events, Notifications, Logging Analytics, and Connector Hub. Together, these services provide operational awareness that extends well beyond traditional infrastructure monitoring.
This article explores why observability has become a foundational capability for modern cloud architecture and why every OCI implementation should consider it during the design phase, not after the first production incident.
When Traditional Monitoring Was Enough
Monitoring has been part of enterprise IT for decades, and for good reason. In relatively static environments, it provided exactly what operations teams needed.
Traditional enterprise applications typically consisted of a web tier, an application tier, and a database server. Infrastructure changed infrequently, deployments followed strict maintenance windows, and application dependencies were easy to understand. If users reported performance problems, engineers could inspect CPU utilization, memory consumption, storage latency, and network activity to identify the source of the issue.
This model worked because infrastructure and application behavior were closely aligned.
As technology evolved, virtualization introduced additional abstraction, allowing multiple workloads to share physical hardware. Monitoring expanded to include hypervisors and storage pools, but the underlying operational approach remained largely unchanged.
Cloud computing fundamentally altered that model.
Infrastructure became dynamic rather than permanent. Resources could be created, scaled, or removed within minutes. Containers and orchestration platforms such as Kubernetes accelerated this transformation even further, allowing applications to scale automatically based on demand.
Today's cloud-native applications consist of dozens or even hundreds of independently deployed services. Each service may be healthy on its own, while the overall customer experience is degraded.
This distinction is important.
Monitoring can confirm that every server is operational, while failing to reveal that a critical business transaction is timing out because of latency in an external API.
The infrastructure appears healthy, The business does not.
Monitoring Answers "What?"
Observability Answers "Why?"
One of the simplest ways to distinguish monitoring from observability is to consider the questions each discipline is designed to answer.
Monitoring focuses on known conditions.
Examples include:
CPU utilization exceeds 85 percent.
Available storage falls below 20 percent.
Database connections exceed a defined threshold.
Network latency increases beyond acceptable limits.
These conditions are valuable because they alert operations teams to problems they already anticipate.
Observability extends beyond predefined thresholds.
It helps answer questions that were never anticipated during system design.
Why are customer transactions taking longer today than yesterday?
Why does latency occur only for users in one geographic region?
Why do database response times appear normal while application performance continues to degrade?
These questions require context rather than isolated measurements.
That context comes from correlating multiple forms of telemetry.
The Three Pillars of Observability
Every mature observability strategy is built upon three primary sources of operational data.
Metrics
Metrics provide numerical measurements collected over time. They reveal trends, support dashboards, and enable alerting.
Examples include CPU utilization, memory consumption, request rates, response times, JVM heap usage, database sessions, and Kubernetes pod counts.
Metrics answer questions such as:
Is the platform healthy?
Are resources approaching capacity?
Has response time increased?
They are efficient, easy to visualize, and ideal for identifying abnormal behavior.
However, metrics rarely explain why the behavior changed
Logs
Logs provide detailed records describing what occurred within systems and applications.
Unlike metrics, logs preserve context.
A single application log entry may reveal an authentication failure, database exception, configuration error, or timeout that would never appear in a CPU graph.
OCI centralizes logs from infrastructure, applications, middleware, and managed services, allowing engineers to search and correlate events across the environment.
Logs tell the story behind the metrics.
Distributed Traces
Modern applications rarely execute within a single process.
A customer request may pass through an API Gateway, multiple microservices, databases, messaging systems, and external services before returning a response.
Distributed tracing reconstructs that journey.
Instead of investigating each component individually, engineers follow a single transaction from beginning to end.
This dramatically reduces troubleshooting time while revealing bottlenecks that traditional monitoring often misses.
Why Dashboards Alone Are No Longer Enough
Organizations often respond to operational complexity by building more dashboards.
Unfortunately, additional dashboards rarely produce additional understanding.
During production incidents, engineers frequently switch between infrastructure monitoring tools, logging platforms, APM solutions, ticketing systems, and cloud consoles.
Every transition increases investigation time.
Every disconnected tool introduces additional uncertainty.
Observability seeks to eliminate these transitions by correlating operational data rather than presenting it in isolation.
The objective is not to display more information.
The objective is to reduce the number of questions engineers must ask before identifying the root cause.
Architect's Perspective
One of the most common misconceptions I encounter is the belief that observability is simply a newer version of monitoring....It ISN'T.
Monitoring is an essential component of observability, but observability extends far beyond infrastructure health.
Think of monitoring as a smoke detector, It tells you something is wrong.
Observability helps determine where the fire started, how it spread, what systems are affected, and which corrective actions should be prioritized.
Both are necessary; One without the other leaves critical operational gaps.
Observability in Oracle Cloud Infrastructure
Oracle Cloud Infrastructure approaches observability as an integrated platform rather than a collection of independent services.
Several capabilities work together to provide end-to-end operational visibility.
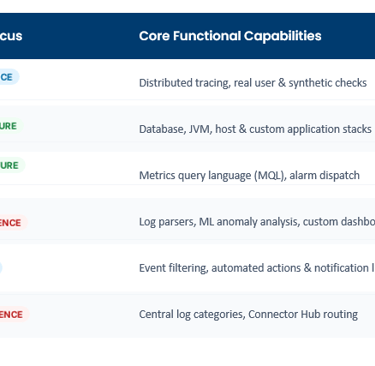
OCI Monitoring collects infrastructure and custom metrics while evaluating alarms.
OCI Logging centralizes operational and application logs.
Logging Analytics applies intelligent pattern recognition and anomaly detection.
Application Performance Monitoring (APM) tracks end-to-end user transactions.
Stack Monitoring visualizes relationships between infrastructure, middleware, databases, and applications.
Events detect changes within OCI resources.
Notifications distribute alerts across operational teams.
Connector Hub automates telemetry movement between OCI services and external platforms.
Individually, each service solves a specific operational challenge.
Together, they provide a comprehensive operational picture that significantly reduces investigation time.
Observability Should Be an Architectural Decision
One of the most valuable lessons I've learned is that observability cannot be treated as something to implement after production deployment.
By that stage:
logging standards differ between applications,
telemetry is inconsistent,
application instrumentation may be incomplete,
critical operational data has already been lost.
Observability should influence architectural decisions from the beginning.
Questions such as:
Which business transactions should be traced?
Which metrics truly represent application health?
Which logs require long-term retention?
Which alerts deserve immediate escalation?
should be answered during solution design rather than operational support.
Organizations that make observability part of their architecture consistently diagnose issues faster and recover from incidents with greater confidence.
Lessons Learned
Across enterprise cloud projects, one observation remains remarkably consistent.
Most organizations do not struggle because they lack operational data.
They struggle because their operational data exists in isolation.
Infrastructure teams view metrics.
Application teams analyze logs.
Database administrators inspect performance reports.
Security teams review audit events.
Each perspective is technically correct, yet none provides a complete understanding of how a business service behaves.
Observability bridges those perspectives, It transforms isolated telemetry into operational intelligence.
Key Takeaways
Monitoring remains essential, but it no longer provides sufficient visibility for modern cloud applications.
Metrics identify symptoms; logs provide context; traces reveal relationships.
Cloud-native architectures demand end-to-end operational awareness rather than isolated infrastructure monitoring.
OCI integrates monitoring, logging, tracing, automation, and analytics into a unified observability platform.
The most successful organizations treat observability as an architectural capability rather than an operational enhancement.
Conclusion
Every significant evolution in enterprise computing has required operations teams to rethink how they manage technology. Cloud computing represents another such shift. Infrastructure is now dynamic, applications are distributed, and customer expectations continue to rise. The operational practices that served traditional data centers well are no longer sufficient on their own.
Observability is not simply another technology trend. It is a response to the increasing complexity of modern architectures. Organizations that embrace observability early gain more than improved monitoring. They reduce troubleshooting time, improve service reliability, strengthen collaboration between engineering teams, and ultimately deliver a better experience for the business.
In the next article, we'll move from strategy to implementation by exploring how Oracle Cloud Infrastructure combines Monitoring, Logging, Logging Analytics, Events, Notifications, and Connector Hub into an intelligent operations platform capable of supporting enterprise-scale cloud environments.

© 2026. All rights reserved.
Stay Updated
Get the latest posts on OCI and cloud tech